Bitcoin Price Outlook: Key Levels After the Rebound
Bitcoin has bounced above $80,000, but the next move is uncertain. Explore key chart levels, market signals and bullish or bearish scenarios before you act.

Bitcoin Rebounded Above $80,000. What Needs to Happen Next?
Bitcoin slipping under $80,000 felt like more than just a dip. It was the first time price had moved below that level in over a month, and the sell-off dragged nearly $948 million into liquidations. Then, as quickly as it broke, Bitcoin bounced the next day - leaving traders asking the same question they always do after a sharp move: was that drop just a shakeout, or did the real correction start when it crossed $80,000?
In the snapshot this article covers, Bitcoin was trading near $82,295, up 1.28% over 24 hours. Several major altcoins had recovered as well. That rebound is encouraging, but it doesn't settle the bigger debate. Longer-term indicators still lean bullish, while the short-term picture is choppier - and prediction-market traders were less confident about a near-term push higher than they'd been earlier in the week.
The most useful way to read moments like this is to stop treating one green day as proof of anything. Instead, set the price levels that would support each scenario - then watch how the market behaves around them. Below is what the bounce looked like in this snapshot, what technical levels traders were watching, and where the signals agree or clash. These figures come from the source snapshot, not live market data.
What Happened in the Bitcoin Market
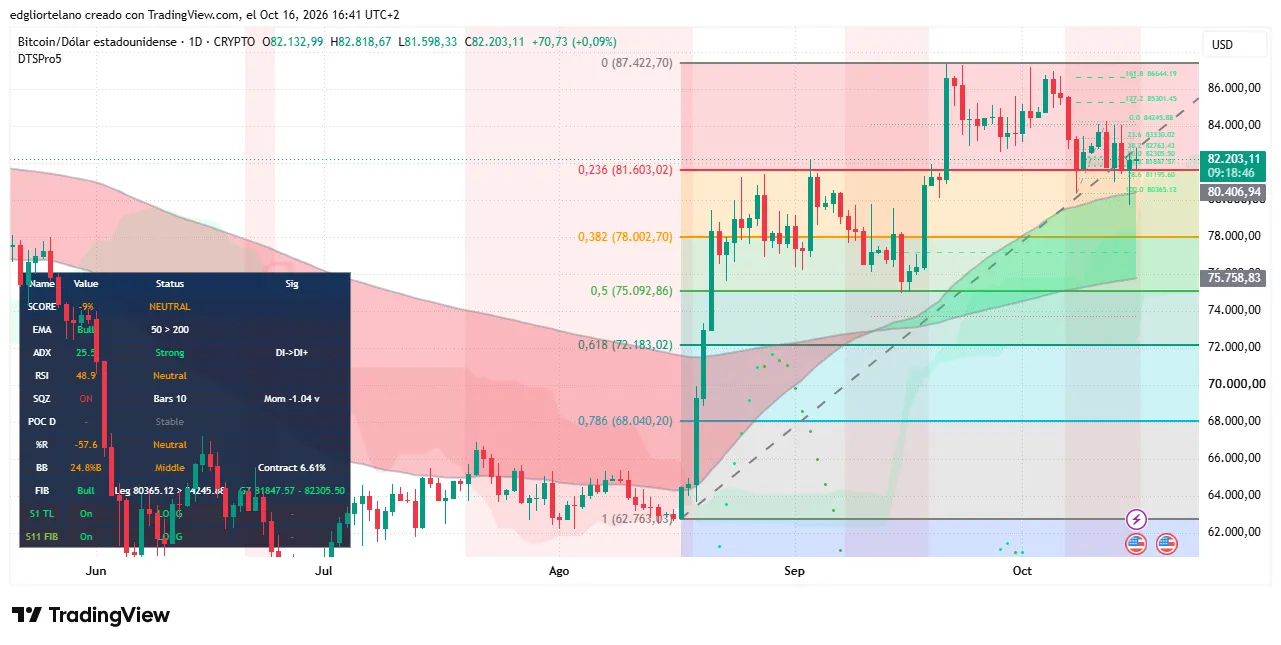
Bitcoin fell below $80,000 on Thursday, hitting an intraday low of $79,711 before recovering. In the snapshot that followed, BTC was at $82,295, up 1.28% over 24 hours. The move brought price back above two levels that had briefly slipped under pressure: a key retracement area around $81,603 and the 50-day exponential moving average near $80,407.
The broader market bounced too. Ethereum rose 4.17% to $2,473.17, Solana gained 3.02%, and XRP added 2.03%. Zcash was the standout among the 15 largest coins by market cap, jumping 10.29% to $1,222.02 - essentially wiping out the almost 10% drop it saw on Thursday.
Still, a broad recovery doesn't automatically mean the sell-off is over. Sometimes bounces happen because forced selling runs out, shorts get squeezed, or buyers step in at a known technical level. What matters next is what happens when price tests those levels again - does demand hold, or does it fade?
Why liquidations can intensify a decline
Thursday's drop triggered $948 million in liquidations, and 90.6% of that was tied to long positions. A long position is a bet that the price will rise, often opened with borrowed funds. If losses push the trader's collateral below the exchange's maintenance requirement, the position can be closed automatically.
When that happens at scale, the selling can pile onto a market that's already moving down. Prices fall, leveraged longs get liquidated, and their positions are sold into the market. That feedback loop can make the move feel sharper than the underlying shift in sentiment alone.
It can work in reverse, too. Once the forced selling clears, a market may bounce as buyers return or traders reduce short exposure. But a liquidation-driven bounce isn't automatically a durable reversal. Traders typically want to see price hold important areas and build on the recovery - not just revisit them.
What the altcoin bounce does - and does not - show
Ethereum, Solana, XRP, and Zcash posting gains suggests this wasn't only a Bitcoin-specific event in the snapshot window. But one day of strength across large-cap coins doesn't, by itself, confirm a lasting change in broader risk appetite. Different assets can move for different reasons, and a strong percentage gain in one coin doesn't mean the rest of the market has to follow.
For Bitcoin traders, altcoin performance is best treated as context. If Bitcoin holds its levels while other majors stay firm, that can support the idea that buyers are returning across crypto. If Bitcoin weakens again, those altcoin gains can unwind quickly. Ultimately, though, the real decision point is what Bitcoin does around its own support and resistance.
The Bitcoin Chart Levels That Matter
A chart level is useful only if it helps you define what would change your mind. A line on a chart is not a promise that price will turn there.
In this snapshot, the market was hovering around $81,603, a retracement level drawn between a notable low and high. Traders use levels like this to estimate where a pullback could attract buyers - or where an attempted rally might run into resistance.
Thursday's wick dipped to $79,711, briefly putting price below both the retracement area and the 50-day EMA (around $80,407). The subsequent recovery brought Bitcoin back above those levels. That's a constructive response in the near term, but the next test is whether price can hold above these areas on a closing basis.
The 50-day and 200-day moving averages
The 50-day exponential moving average weighs recent prices more heavily than a simple moving average. In the source snapshot, it was around $80,407. Bitcoin briefly trading below it likely unsettled short-term traders; moving back above gives buyers a level they can defend if the rebound is going to keep going.
The 200-day EMA was near $75,759 - about 8% below Bitcoin's price in the snapshot. The 50-day EMA sitting above the 200-day EMA matters to many technical traders because it often signals the longer-term trend is still bullish: recent averages are still higher than the older ones.
This reading is more of a filter than a forecast. Moving averages are built from past prices and change slowly, which means they can describe trend direction, but they can't tell you when that trend ends or how deep a correction might get.
ADX and RSI point to a less decisive short-term picture
ADX (Average Directional Index) is about trend strength, not whether the trend is bullish or bearish. Readings above 25 are often taken as evidence that a meaningful trend is underway. Bitcoin's ADX was 25.5 - just above the threshold - so the signal was, at best, modest.
Directionally, the indicators were less friendly for buyers. The negative directional indicator (DI-) was ahead of the positive indicator (DI+). That suggests sellers had the upper hand in the recent directional move. It doesn't guarantee price must keep falling, but it does argue for waiting for stronger confirmation before assuming the rebound has turned into a fresh uptrend.
RSI (Relative Strength Index) was 48.9. RSI runs from 0 to 100 and is often used to gauge momentum. Values above 70 are commonly described as overbought; below 30 is often described as oversold. At 48.9, Bitcoin was close to neutral, with a slight lean toward sellers. In other words: it bounced, but it hadn't shown strong upside momentum yet.
Taken together, the indicators are mixed. The moving-average setup supports the longer-term trend, while ADX/DI/RSI don't offer strong evidence that buyers have regained control in the short run. Price levels and follow-through matter more than any single indicator.
Three Possible Paths for Bitcoin
You get more value from scenario planning than from trying to bet on one exact outcome. The point is to lay out what evidence would support a bullish, sideways, or bearish view - and what would contradict it.
The levels below come from the source snapshot, so they're not meant as live targets.
Bullish: defend $81,603 and clear $84,246
The bullish case starts with Bitcoin holding above $81,603. A sustained move above $84,246 would be a stronger signal that buyers are taking control again. From there, the chart levels identified in the analysis were $85,301, $86,644, and a recent high around $87,423.
If ADX starts rising alongside those advances, it would add weight to the idea that the trend is strengthening. The key difference is between a brief push through resistance and a close that actually holds above it. In markets that move fast, intraday breaks can fade - especially right after liquidation-driven volatility.
This bullish view weakens if Bitcoin loses $81,603 again and can't get it back. A price target isn't a plan by itself. You still need to know what market behavior would prove you wrong.
Sideways: trade between roughly $80,365 and $84,246
In the sideways scenario, Bitcoin stays between a swing low near $80,365 and resistance near $84,246. In this setup, the rebound doesn't turn into a breakout. Instead, buyers keep showing up before price can establish a sustained move lower.
Range trading is usually harder than it looks. A trading band invites repeated attempts - buy near support, sell near resistance - but those zones can fail without much warning. If you're trading inside a range, you may need smaller position sizes or clearly defined invalidation points, because once volatility picks up, a narrow setup can turn into a fast losing trade.
For longer-term participants, a range can also just mean there isn't enough new information to change the thesis. Sitting tight is a legitimate choice when price is stuck between levels and the risk-to-reward isn't clearly favorable.
Bearish: lose support and test lower levels
The bearish view strengthens if Bitcoin prints a daily close below $81,603. The next areas from the snapshot were the 50-day EMA near $80,407 and the swing low around $80,365. If those don't hold, the analysis points to $78,003, then a zone between $75,759 and $75,093.
That lower area stands out because it lines up the 200-day EMA near $75,759 with a 50% retracement level around $75,093. Clusters like that often attract attention - but they don't guarantee a floor. If price reaches the zone, traders still have to judge whether buyers are truly defending it.
A daily close through support is more meaningful than a quick wick, because it shows where the market settled for the day. Even then, one close doesn't remove uncertainty. What matters is whether price keeps selling after the break - or whether it quickly reclaims the level.
How to Read Prediction-Market Signals
Technical analysis isn't the only thing traders use. On Myriad, a prediction market operated by Dastan (Decrypt's parent company), traders assigned a 31% probability to Bitcoin reaching $87,500 in October. That was down from 45% on Tuesday. In another market, traders put a 43% chance on Bitcoin falling to $77,500.
Those numbers suggest traders were less confident about a near-term upside push than earlier in the week, while still assigning real probability to a lower price. That fits with the mixed technical picture: the longer-term moving-average structure remained supportive, while short-term indicators hadn't clearly shifted in buyers' favor.
A prediction-market probability isn't a price target, a guarantee, or a survey of every crypto investor. It reflects positions and pricing in a specific market at a specific time. Liquidity, market design, fees, and participant incentives can all influence the odds you see. A 31% probability doesn't mean Bitcoin can't reach $87,500, and a 43% probability doesn't mean a move to $77,500 is inevitable.
Use these markets as one input - sentiment, not a trading plan. If the chart signals and prediction odds point in different directions, ask what each one is really measuring. The chart is about price behavior and structure; the prediction market reflects what participants are pricing into a defined outcome. Neither tells you how much risk you should take.
One practical way to combine both is to set conditions in advance:
- Bullish evidence: Bitcoin holds above $81,603, clears $84,246, and shows stronger trend momentum.
- Neutral evidence: Price stays between roughly $80,365 and $84,246 without a convincing breakout.
- Bearish evidence: Bitcoin closes below $81,603, then fails to reclaim the $80,407-$80,365 support zone.
This approach doesn't eliminate uncertainty - it just makes it explicit, which is more useful than treating a single indicator (or a single probability) like it's the answer.