XRP Exchange Inflows Hit a Seven-Month High
XRP exchange inflows reached 6.05 billion tokens in 30 days, while whale outflows fell to a five-year low. See what these on-chain signals do—and don’t—show.

XRP Inflows Are Rising, but Whales Aren't Following
XRP is heading onto exchanges at its fastest pace in seven months. More than 6 billion tokens have flowed to exchanges tracked by CryptoQuant over the 30 days to October 19, 2026 - about double the level seen in mid-August. Still, the same data points to a quieter picture among large holders: the 90-day average of whale outflows has fallen to its lowest level in five years.
At first glance, those signals can feel like they contradict each other. Exchange inflows are often treated as a warning that investors might be preparing to sell, while whale withdrawals can look like accumulation or a move into custody. But these metrics don't tell you what a wallet owner actually intends to do. Transfers can happen for trading, liquidity, custody, or operational reasons, and on-chain data doesn't reveal every owner or explain the purpose behind each move.
So the right question isn't "bullish or bearish?" in isolation. It's what these numbers suggest about market positioning, what they leave out, and what additional evidence would help verify any real shift. Here's what the latest XRP flows show, why whale activity has cooled, how rangebound prices complicate the read, and a practical way to interpret the data without turning it into a trading trigger.
What the latest XRP exchange-flow data shows
CryptoQuant reported that rolling 30-day XRP inflows to tracked exchanges reached 6.05 billion tokens on October 19. That's the highest reading since March and roughly double the mid-August level. Over a similar stretch, XRP/USD rose from around $1 to a high near $1.70 before correcting to about $1.30.
The timing matters, but it doesn't prove cause and effect. Exchange deposits during a price run-up can mean more tokens are available for trading. They can also reflect transfers between wallets and exchanges, market makers adjusting inventory, or holders moving funds to platforms for reasons that aren't tied to an immediate sale. Most importantly, the metric captures movement to exchanges - not completed trades.
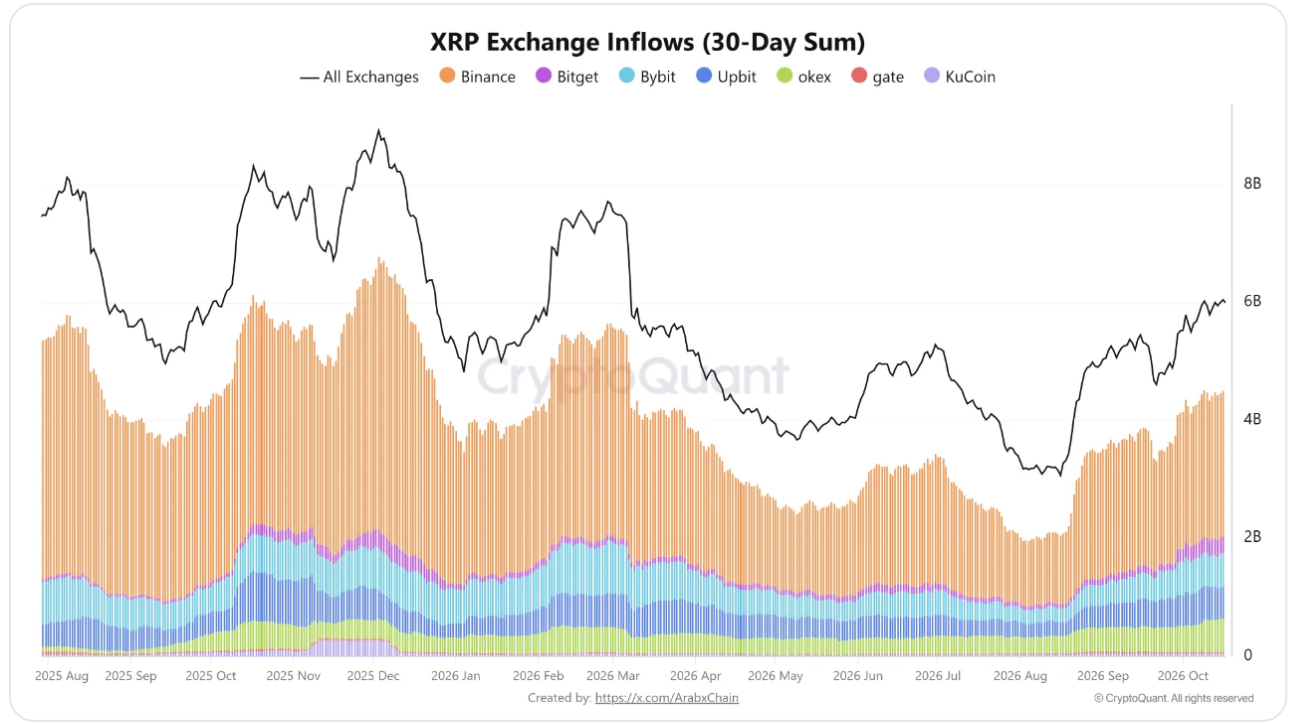
What an exchange inflow measures
An exchange inflow is typically a transfer of an asset to an address identified as belonging to a trading platform. Analysts pay attention because tokens on exchanges are generally easier to sell or trade than tokens kept in self-custody. If deposits stay elevated, it can suggest that more potential supply is moving closer to the market.
But potential supply isn't the same thing as actual selling pressure. A deposit might be followed by a sale, but it might also be tied to an unfilled limit order, a transfer to another exchange, or no trade at all. Exchange wallets can also pool funds from many users, so you can't reliably tell whether a "large" deposit came from one investor or multiple customers.
That's why the 6.05 billion figure needs context. It's the volume of XRP moving into tracked exchanges over a rolling period. It doesn't mean 6.05 billion XRP were sold, and it doesn't show whether those deposits came from investors expecting prices to fall.
Why the seven-month high deserves attention
Even with those limits, the change is noticeable. A doubling in 30-day inflows suggests XRP has been moving toward exchanges more than it did in August. If deposits remain high and you also see rising exchange balances, heavier realized selling, and weaker spot demand, the case for distribution gets more convincing.
On the other hand, if inflows rise but exchange balances stay flat or decline, the activity may be more about day-to-day trading and withdrawals than a lasting increase in available supply. The market reaction matters too. Big deposits that line up with price stability and healthy liquidity can mean something different than big deposits paired with persistent selling and worsening order books.
The takeaway: treat this as a shift in market activity, not a standalone forecast. The data raises a question about potential supply. It doesn't answer whether that supply will show up as sell orders.
Why whale outflows matter - and what they cannot prove
The second piece of the story is the drop in XRP whale outflows. CryptoQuant's 90-day moving average of whale outflows peaked at about $3.5 billion in February 2025, shortly after XRP was reported to have hit an all-time high near $3.40. By October 2026, that average had fallen to $49.7 million - the lowest since October 2021 - down about 98.6% from the peak.
CryptoQuant frames this as evidence that XRP is getting less attention from large-volume investors. Its interpretation is that some whales may be waiting for more attractive prices before adding exposure. That's plausible, but it's still an interpretation, not a confirmed read on intent.
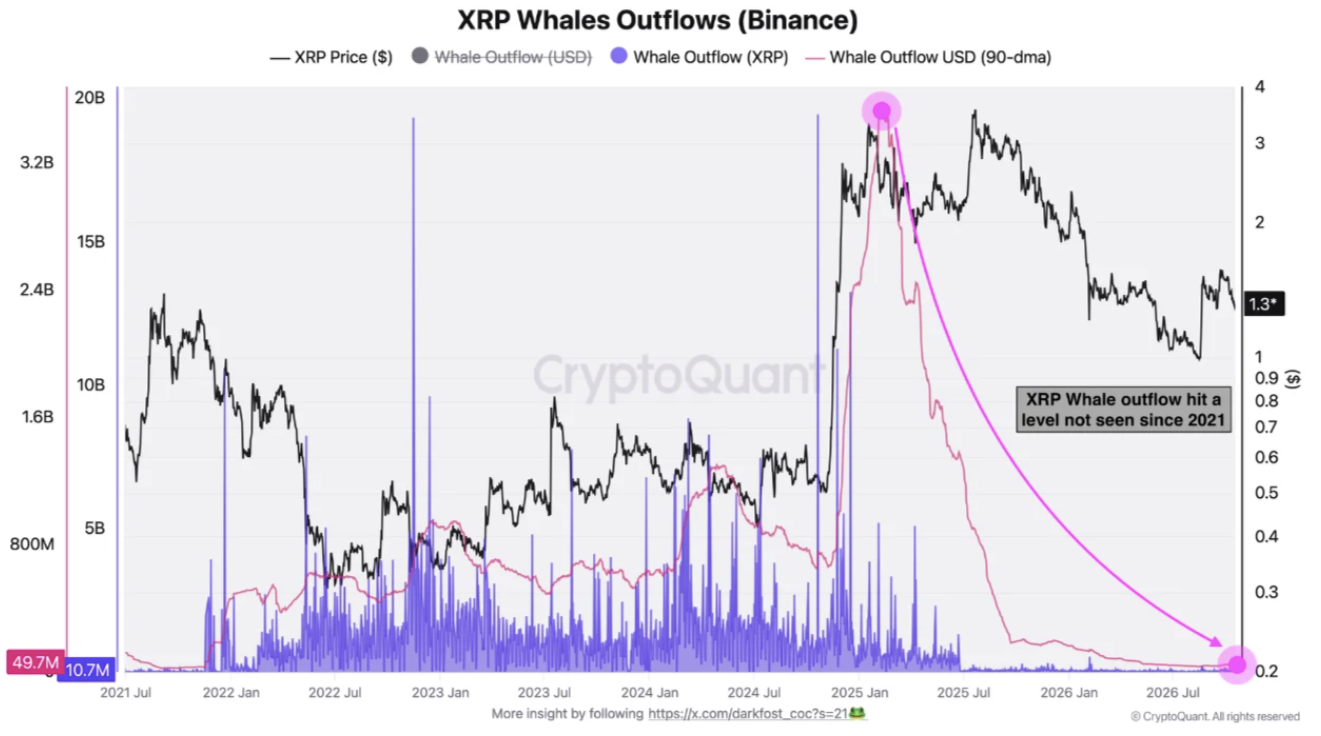
What whale outflows can tell you
Whale outflow metrics track large transfers away from exchanges, using the provider's labels and methodology. In some cases, withdrawals line up with accumulation: a large holder buys tokens and moves them into self-custody. So a decline in withdrawals can suggest that this specific kind of activity has cooled.
But a withdrawal isn't automatically a buy, and low withdrawals don't prove whales aren't accumulating. Large investors can use internal exchange accounts, custodians, over-the-counter desks, or wallets that analytics firms don't classify as "whale addresses." Some may keep assets on exchanges for operational reasons. Others may move tokens between wallets without changing their overall market exposure.
There's also the smoothing effect. The 90-day average dampens day-to-day noise, which helps filter out one-off transfers. The trade-off is that it responds more slowly to recent changes. A low average tells you measured outflows have been subdued over time, not what large holders will do next - or whether they'll stay quiet.
The risk of reading low whale activity as a price target
Dropping from $3.5 billion to $49.7 million is striking, but it starts from an unusually high baseline. After a major price peak, large holders often reposition in a way that may not repeat at the same pace. A steep percentage decline from that peak, by itself, doesn't prove the market is unusually bearish or that a reversal is near.
A more useful question is what the market might be missing if whale activity stays low. CryptoQuant's view is that XRP may lack a source of buying volume without meaningful whale participation, while also pointing out the asset's resilience through the 2026 crypto bear market. That points to a possible constraint: if large buyers aren't showing up, other demand sources have to carry more of the load.
Those sources could include retail activity, institutional products, payment-related use, or trading demand. But the flow data here can't tell you whether any of those are increasing or decreasing - you'd need to measure them separately instead of assuming they're moving in lockstep with whales.
How price action and realized profits fit the picture
XRP moved from roughly $1 to around $1.70, then corrected toward $1.30. That range gives the flow data some context. CryptoQuant's commentary suggests conditions are becoming rangebound again. In a range, investors often have less incentive to chase price in either direction. Some take profits near the top. Others wait for a clearer break before adding risk.
CryptoQuant also reported that XRP's realized profit/loss ratio fell 41% in October. When that ratio drops, it means realized profit activity weakened relative to realized losses in the measure's comparison. It can line up with less aggressive profit-taking, but the number alone doesn't tell you whether investors are suddenly more confident, more cautious, or simply less active.
A separate Bitcoin signal, not confirmation for XRP
Bitcoin data can be a useful comparison, but it shouldn't be treated as direct evidence about XRP. Glassnode reported that Bitcoin traded in a range between $80,000 and $87,000 in October. In its Market Pulse bulletin, Glassnode said the realized profit/loss ratio fell from 0.8 to 0.4 over the week covered there - a 50% drop.
Glassnode characterized that as cooling profit realization versus loss realization and a shift toward more subdued spending. The broad idea echoes the XRP setup: profit-taking activity appears to have eased while prices move within ranges. Still, Bitcoin and XRP are separate assets, separate datasets, and separate time windows. Bitcoin's ratio doesn't confirm what XRP holders are doing.
What a rangebound market changes
When prices move sideways, on-chain signals can become harder to interpret. An exchange deposit might be setting up a trade somewhere inside the range rather than signaling a bet on a breakdown. A withdrawal could be about custody preferences, not conviction that prices will rise. Even lower realized profits might simply reflect fewer investors finding a strong reason to transact at current prices.
That's why price has to be checked alongside flows. If XRP breaks below a range while exchange deposits stay elevated and spot selling picks up, the bearish interpretation gains support. If price holds, liquidity improves, and deposits get absorbed without sustained downside, those same inflows can look more like trading activity than a wave of distribution.
Neither scenario is guaranteed. Ranges can last longer than traders expect, and breakouts sometimes fail. The goal isn't predicting the next move from one chart. It's seeing whether different signals point to the same kind of story.
A practical framework for reading XRP on-chain data
On-chain indicators work best when you treat them as evidence to test - not instructions to follow. For this XRP setup, it helps to run the data through four questions.
1. Is the flow change persistent?
A single daily spike can come from a large transfer or an operational event. The 30-day rolling inflow figure is more informative because it covers a sustained period, but you still need follow-up. Check whether inflows stay elevated in the weeks ahead and whether the trend shows up across more than one data provider.
Also compare the rolling inflow to exchange balances. If deposits look high but total exchange balances don't increase, tokens may be moving through exchanges and leaving again. If balances build over time, the case for more immediately available supply strengthens.
2. Are large holders adding, withdrawing, or just staying quiet?
Consider whale inflows and outflows together - not just outflows. A drop in withdrawals is hard to interpret on its own. If whale inflows rise while total exchange deposits rise, that's a different signal than low activity across both sides. And remember that wallet labels are imperfect. Provider-defined "whale" categories can miss custodians, exchange-linked wallets, and entities whose ownership isn't publicly known.
Where possible, compare on-chain findings with broader market data. Spot volume, derivatives positioning, and liquidity can help indicate whether the market is absorbing supply or getting more fragile. No single source captures the full picture.
3. Is price confirming the flow data?
Flows matter because they can change the balance of available supply and demand. Price is how the market responds. If an apparent increase in selling supply doesn't push price lower, buyers may be absorbing it - or the deposits may not be converting into actual sales. If price weakens alongside deposits and realized losses rising, the combined evidence looks more concerning.
For this setup, the move toward $1.30 after a high near $1.70 is useful context, not a complete technical analysis. These figures don't define hard support or resistance levels. Any levels you use should come from current charts, not from inference based on flow statistics.
4. What would change your view?
Before you settle on a conclusion, define what evidence would strengthen it - or weaken it. For example:
- A stronger distribution case: elevated inflows persist, exchange balances increase, spot selling grows, and price keeps sliding.
- A more neutral interpretation: inflows stay high but balances don't build, trading volume remains steady, and price holds its range.
- A stronger accumulation case: exchange balances decline, measured whale withdrawals recover, and price rises with sustained spot demand.
These are scenarios, not predictions. Laying them out explicitly reduces the temptation to treat every new data point as proof of whatever you already hoped to see.
For background on the reported figures, see the original CryptoQuant-based analysis.
Conclusion
XRP's 6.05 billion tokens in 30-day exchange inflows point to more movement toward exchanges. At the same time, measured whale outflows are far below their 2025 peak, and realized profit activity appears to have cooled. Taken together, that looks more like a market with more exchange-directed movement but less visible participation from large holders - not a simple bullish or bearish verdict.
The key distinction is between movement and intent. Tokens arriving at exchanges aren't automatically sold, and lower whale withdrawals don't prove large investors have exited XRP. The next useful check is whether exchange balances keep rising, whether spot selling follows, and how price responds.
If you're tracking XRP, use the data to guide questions - not to shortcut decisions. Look for whether signals persist, compare independent measures, and decide ahead of time what would change your assessment. That's usually more reliable than treating one on-chain metric as a forecast.